Savings Plans Analytics
AWS Savings Plans provide a flexible, simple way to save on your usage versus on-demand pricing. To maximize their full benefit and ensure they are working optimally across your deployment, you must analyze key Savings Plan usage data.
The Savings Plan Analytics report empowers you to identify your coverage, cost, savings, utilization, and waste with zero configuration. The report allows you to see these trends over 1, 3, 6, or 12 month timeframes to gauge the effectiveness of your Savings Plans against your resource fleet.
Prerequisites
To leverage the Savings Plan data in CloudCheckr CMx, you must:
- Use AWS as a cloud provider;
- Purchase an AWS Savings Plan;
- Use the AWS Cost and Usage Report (CUR) as your billing method; and
- Use the updated Cost Least Privilege Policy, granting IAM permissions to
savingsplans:DescribeSavingsPlans.
Users must have View reserved usage reports permissions to access this report.
Accessing the Report
The Savings Plans Analytics report is available to all AWS payer accounts in CloudCheckr.

To access the report, navigate to Home > Cost > Reserved Usage > Savings Plans Analytics. You can also search for Savings Plans in the report search bar at the top of the application.
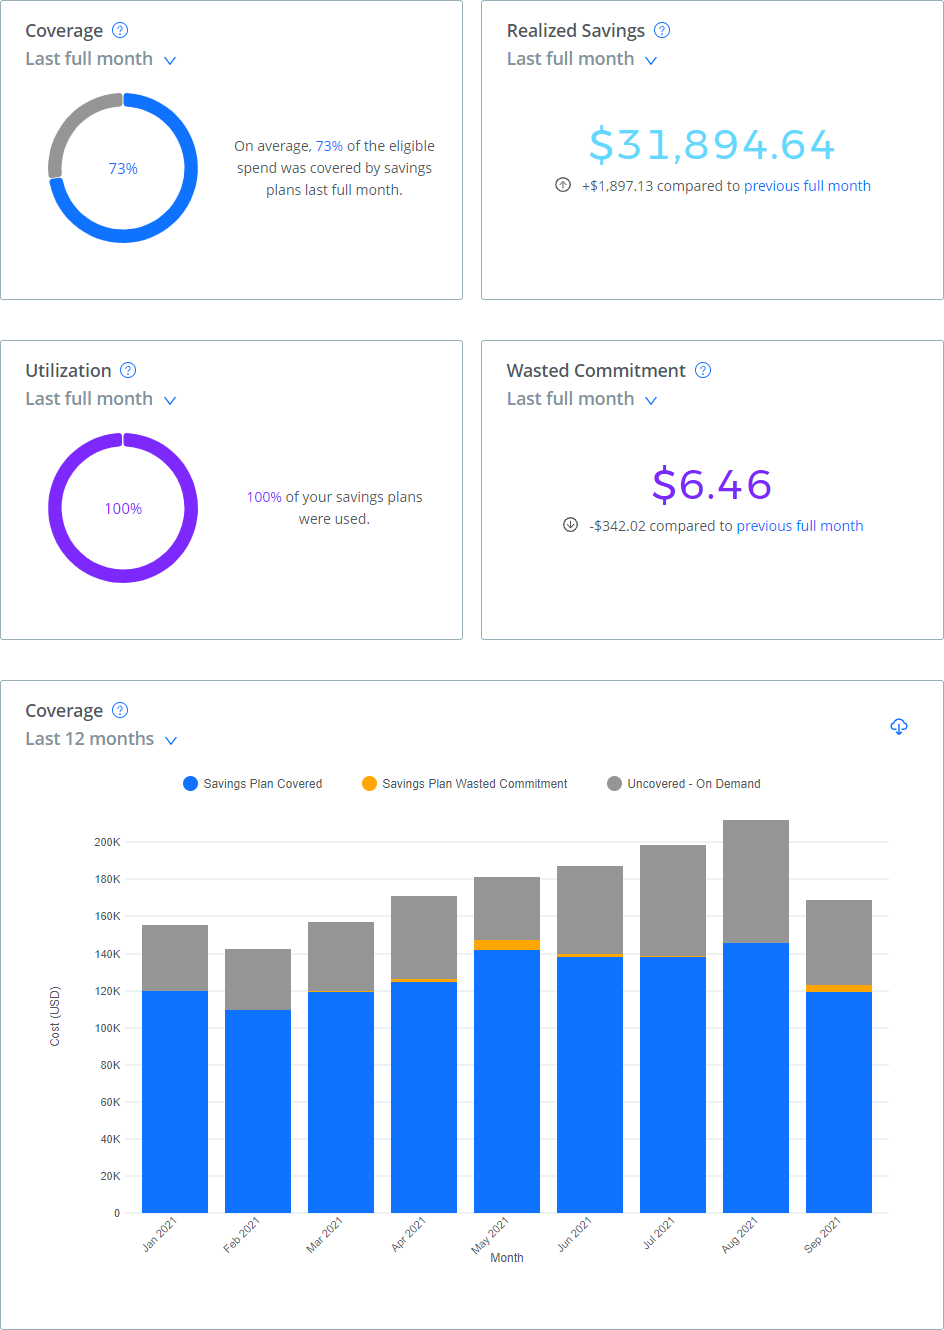
Coverage, Utilization, & Waste
Am I wasting any Savings Plans, and is there room for optimization?
After you purchase Savings Plans, you'll want to make sure that you're taking full advantage of your available discounts and not wasting any savings opportunities. But it's not good enough to just know how you're doing right now. You need to be able to see recent and historic trends and ensure you're maintaining a healthy Savings Plan portfolio.
Our Coverage, Utilization, and Waste charts show how well your Savings Plans are, and have been, performing. By identifying how much of your total usage is left uncovered by any Savings Plan, you can decide whether investing in additional Savings Plans would be wise. When examining the uncovered usage, keep in mind that you may also have RIs covering some portion or all of that usage. The utilization and wasted commitment data informs you on whether you've over-purchased Savings Plans.
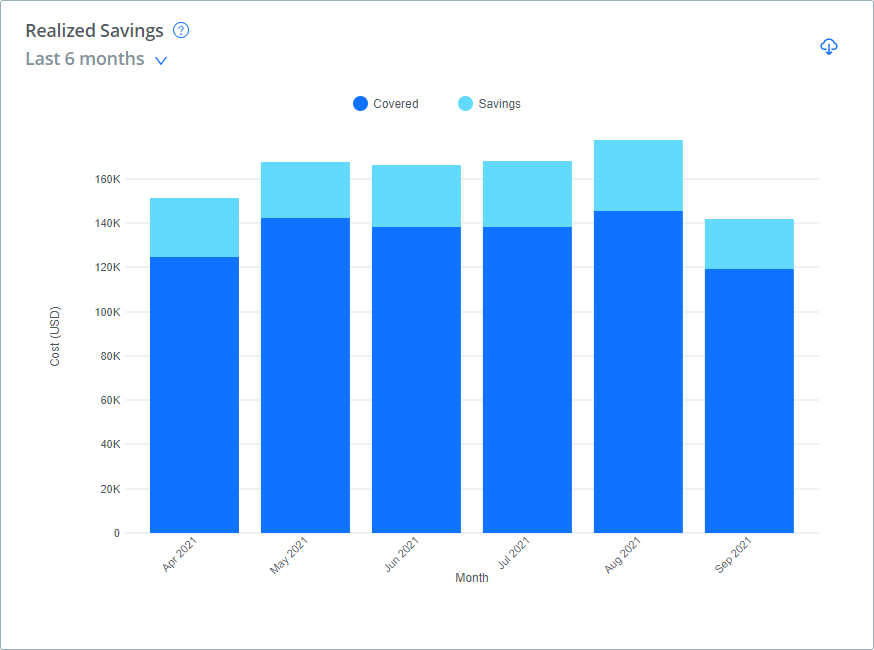
Savings
How much money have I saved with my Savings Plan strategy?
The Realized Savings chart tracks how much your Savings Plans have actually saved you versus what the same usage would have cost at On-Demand pricing. This data is presented both in a bar chart, for easy trend analysis, and as a dollar figure, comparing current savings versus historic.
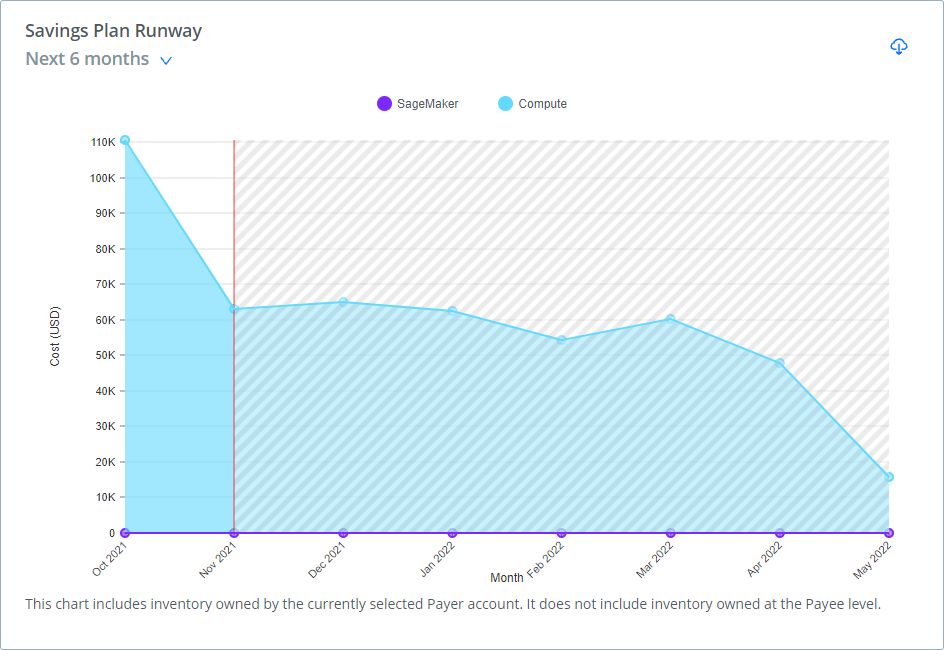
Runway
What are my total Savings Plan commitments right now? What about in the future?
The Savings Plan Runway chart shows you the total commitment of your Savings Plans within the next 3, 6, or 12 months. This data can be compared with the last 3 or 6 months as well, giving you a more informed idea of your past, present, and future Savings Plan commitments. By looking at the total commitments of all your Savings Plans on the Runway chart, you can more easily decide if you need to purchase additional Savings Plans to cover periods of peak consumption or for months when your current Savings Plans are set to expire.
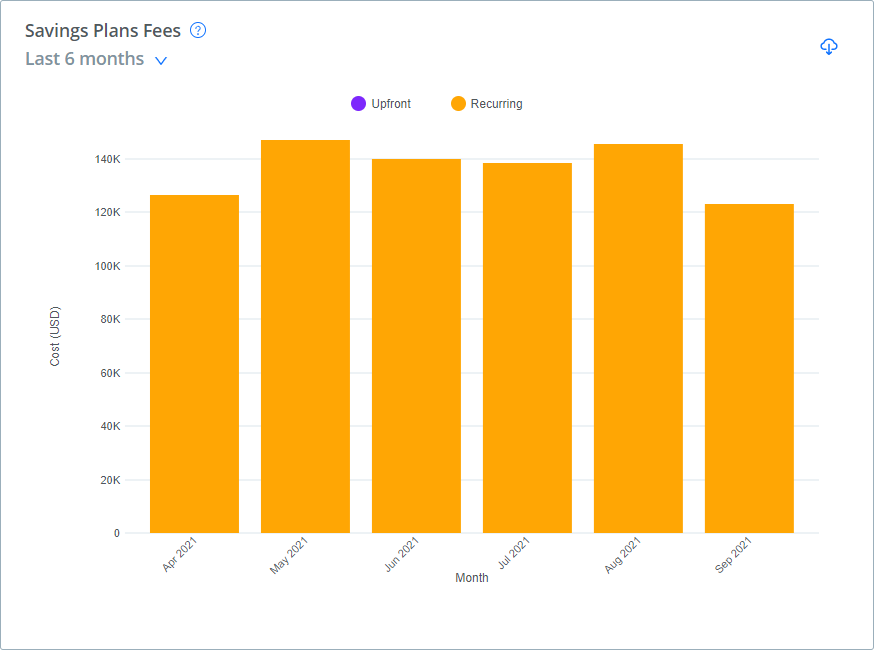
Fees
How much did I spend on Savings Plans to achieve my savings?
The Savings Plans Fees chart shows you how much your Savings Plans cost, broken out by upfront and recurring fees. This data is a reflection of the actual cost in each monthly bill and does not amortize the upfront costs across the term of a Savings Plan. This data can also be viewed over 1, 3, 6, or 12-month timeframes to track your historic spend.
Inventory
How much am I spending on my current Savings Plans?
The Inventory table shows you a detailed description of each of your Savings Plans, including the Type, Status, Commitment types, and Fees. You can filter and search this table to find the data you need more quickly. You can then export this data to a CSV file for further analysis.
